
DARRYL BARTLETT
Business Intelligence Analyst / Data Analyst
About Me
Hi, my name is Darryl Bartlett. Thank you for taking the time to visit my project portfolio. Here you will find a showcase of my work and abilities.This is my opportunity to show you some of my qualifications. Especially, skills beneficial to the role of a Business Intelligence Analyst (or other associated roles like Data Analyst).My background is in IT, but I would love to pivot into a BI analyst type position. I'm a curious problem solver, always willing to learn more, and a good communicator. I've used different types of SQL (SQL Server, MySQL, PostgreSQL). And I've always enjoyed working with data and producing reports.The projects in my portfolio have been built with different business intelligence tools. Including Power BI, Tableau, and Looker Studio.Please take a look around. I welcome any feedback or questions you might have.
Skills
EXCEL | POWER BI | TABLEAU | LOOKER STUDIO | SQL
ERP Reporting
Team Collaboration
Stakeholder Communication
Support Documentation
Requirements Gathering
Project/Task Organization
Click the button below to see my projects.
Projects
In this section you can find my projects. Click the View Project buttons to see the dashboards, the project briefs, and to get an idea of what I did for each project.
POWER BI
Multi-Channel Marketing Dashboard
Combined marketing data from 5 different ad platforms to simply measuring and tracking of campaigns.
Tableau
Call Centre Dashboard
Monitoring the performance of sales teams to help improve agent efficiency.
Looker Studio
Hotel Reservations Dashboard
Moving hotel reservation data from an Excel workbook into 3 dashboards.
POWER BI
Multi-Channel Marketing Dashboard
Other Tools Used:
Power My Analytics,
Google BigQuery

PROJECT OVERVIEWClient:
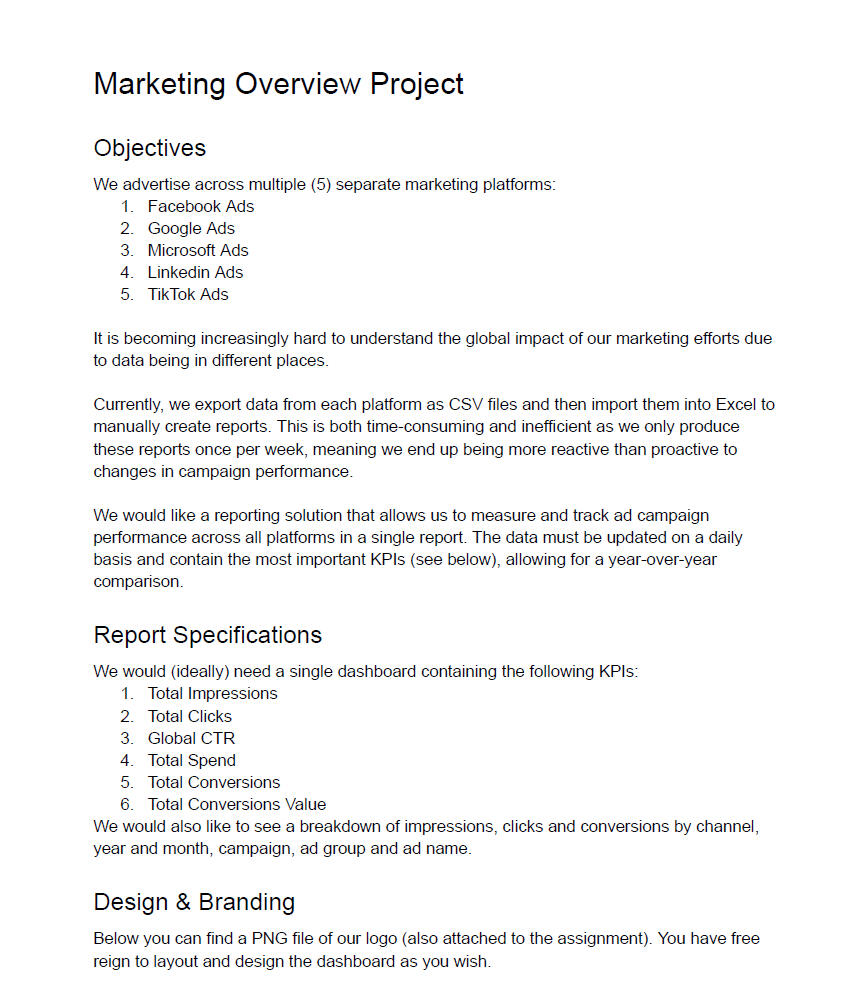
Idea Creative Marketing StudioClient Problem:
Idea Creative runs advertising across five different ad platforms (Facebook, Google, Microsoft, LinkedIn, and TikTok). They lack time to manage the impact of their marketing due to juggling many ad platforms.The process they use for producing reports is currently manual:
1. Exporting data into a CSV file for each platform
2. And then importing each file into ExcelTheir current process is time consuming which only gives them time to do the reports once a week.Client Request:
Idea Creative would like to have a single dashboard that runs daily. This would give them a quicker turnaround time. And also let them measure and track ad campaign performance for all platforms from one place.Report Requirements:
KPIs
- Total Impressions
- Total Clicks
- Global CTR
- Total Spend
- Total Conversions
- Total Conversions ValueInclude
- Impressions, clicks and conversions by channel
- Impressions, clicks and conversions by year and month
- Impressions, clicks and conversions by campaign, ad group and ad name
Project Brief
This project brief includes Idea Creatives description of their reporting concerns. And also their requirements for the new report.

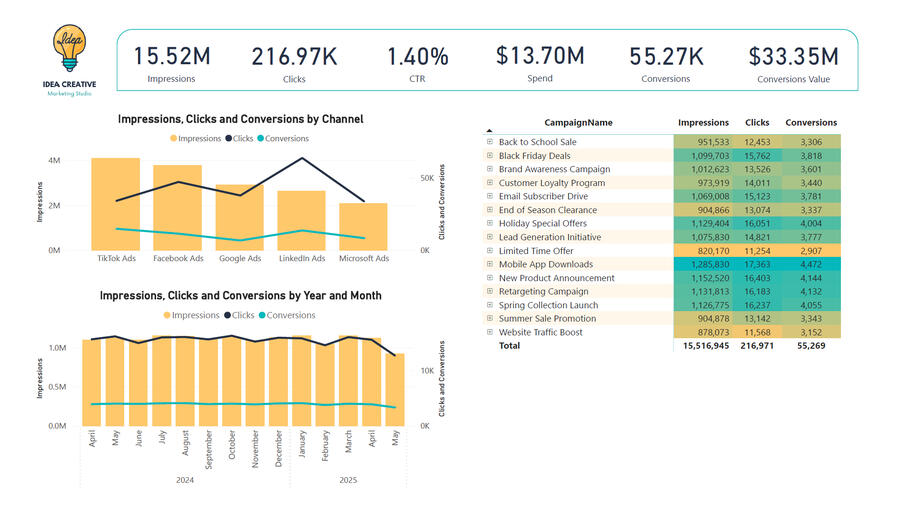
Insights
Overall, this dashboard would be a dream setup for Idea Creative. They are going from multiple reports retrieved once a week, to a single interactive dashboard that is updated daily. It will relieve a burden and time they didn't have.They'll have a better view of their different ad platforms. And it will let them better understand where their advertising dollars are best spent.For example, with a quick glance of the Channel chart, you can see TikTok is one of their best performing ad platforms for conversions. Even though TikTok has the most impressions, it has one of the lowest amount of clicks, but their conversions on those clicks are the highest.They can dig into any ad campaign and see what's working and what isn't. This will let them pivot by making changes to a campaign quickly. Better campaigns will lead to more impressions, clicks and conversions.As another example, when you look at the Campaign table, the Mobile App Downloads stands out among all campaigns. Idea Creative can now dig into the data to see which platform is working for this campaign, when it's been working, and which ads have been working the best.
Tools Used:
1. Power My Analytics
2. Google BigQuery
3. Power BIData Used:
Sample data extracted from Power My Analytics.ETL Process:
1. Data was retrieved for each ad campaign from Power My Analytics
2. The data was transferred to BigQuery and combined into one data source using SQL
3. The new data source was imported into Power BI to build the dashboards
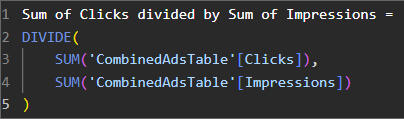
Power BI Measure Created
One measure was created for the dashboard to calculate click-through-rate (CTR).
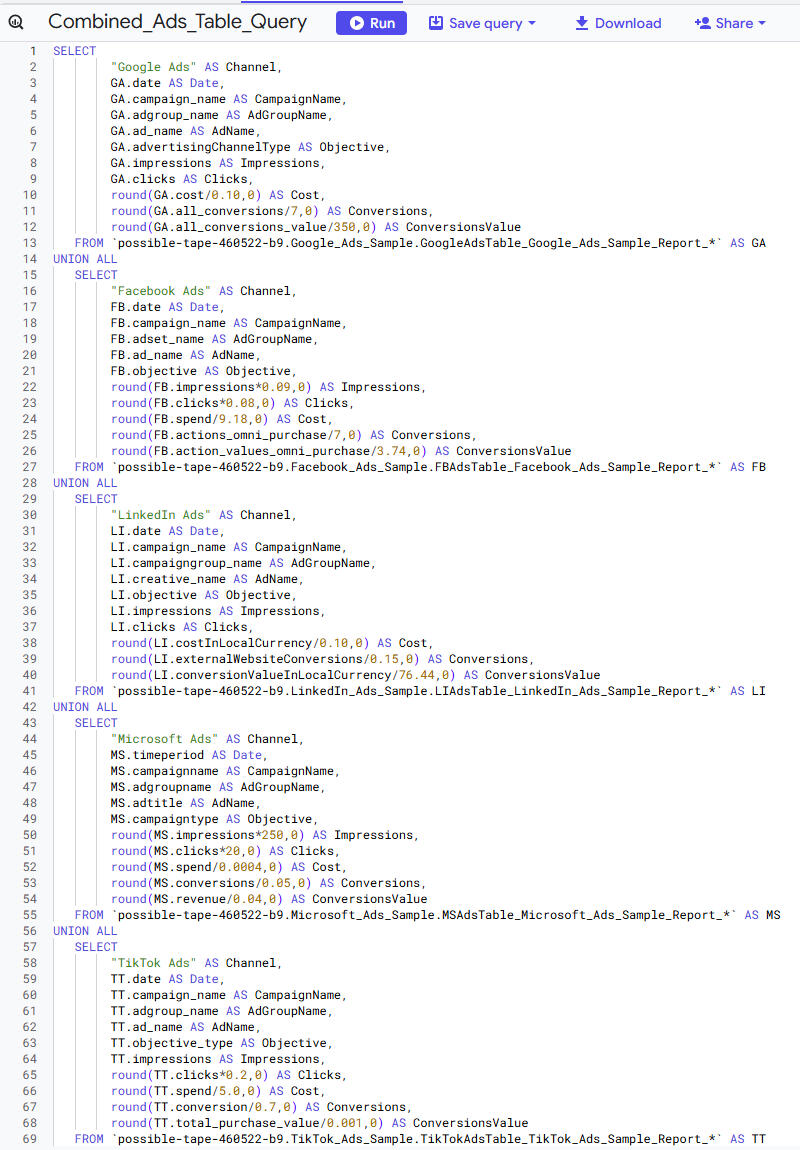
PROJECT WALKTHROUGHAd Campaign Reports
Reports for each of the five ad campaigns (Facebook, Google, LinkedIn, Microsoft, TikTok), were created in Power My Analytics using sample data. The initial reports pulled 13-months of data. Each report was then scheduled to pull data on a daily basis.The five scheduled reports exported new data daily to Google BigQuery.SQL Query
A UNION ALL SELECT statement was written in BigQuery to combine the different ad campaigns into one data source.
Power BI Dashboard
The data file from BigQuery was imported into Power BI. It was used to build the new dashboard based on the report specifications. The completed dashboard was published to Power BI in the Microsoft Fabric cloud environment.Bar charts along with two lines were used for the Channel and 'Year and Month' data because the impression values are so large. These charts wouldn't represent the data well if they were only using line charts.A table was used for the campaign data due to having a lot of drill-down data for ad information (campaign name > ad group > ad name).
Interests
Other possible questions Idea Creative could answer by using the dashboard:
- Which campaigns produced the highest CTR?
- How did CTR perform for platforms and campaigns by year and month?
- Why are mobile app downloads so popular?
- Are there campaigns that are more seasonal than others?
- Would adding in data for profit be useful on the dashboard?
- Would adding in the conversion rate % to the dashboard be helpful?
Tableau
Call Centre Dashboard
Other Tools Used:
Microsoft Excel,
Google Sheets

PROJECT OVERVIEWClient:
BookATable Restaurant ReservationsClient Problem
BookATable is a call centre for restaurants businesses. They were not been able to monitor the performance of their sales teams and agents. Their 20 agents are spread evenly across 4 sales teams. Each sales team also has a team lead. Their biggest need was knowing where they can improve efficiency and where to provide training for staff memebers.Client Request
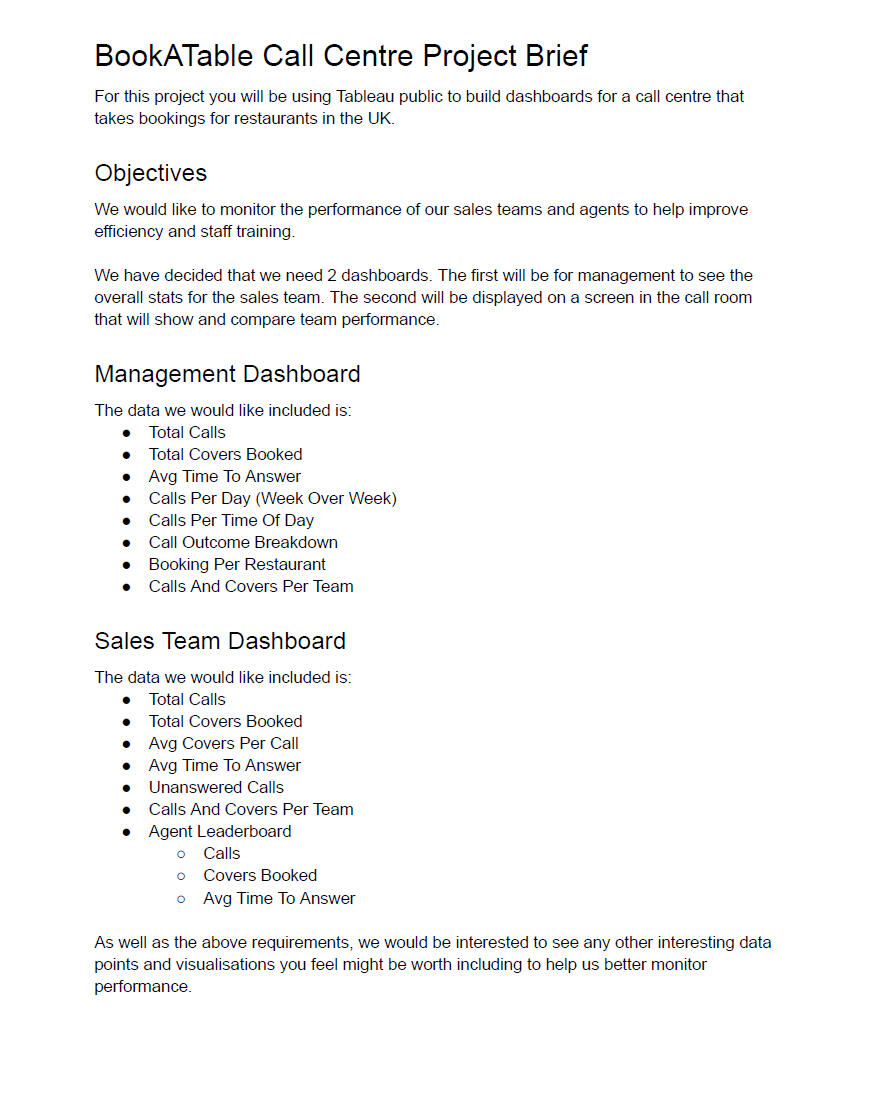
BookATable requested 2 dashboards to be built. One dashboard for management to see on-going stats of the sales team. And a second dashboard to put in the call centre for comparing sales teams and agent performance.Report Requirements
1. Management Dashboard
- Total Calls
- Total Covers Booked
- Avg Time To Answer
- Calls Per Day (Week Over Week)
- Calls Pert Time Of Day
- Call Outcome Breakdown
- Booking Per Restaurant
- Calls And Covers Per Team2. Sales Team Dashboard
- Total Calls
- Total Covers Booked
- Avg Covers Per Call
- Avg Time To Answer
- Unanswered Calls
- Calls And Covers Per Team
- Agent Leaderboard
+ Calls
+ Covers Booked
+ Avg Time To Answer
Note: In the context of restaurant reservations, "Covers Booked" refers to the number of guests (or "covers") that have made reservations for a specific time or shift.
Project Brief
This project brief includes BookATable's description of their reporting concerns. And also their requirements for the new dashboards.
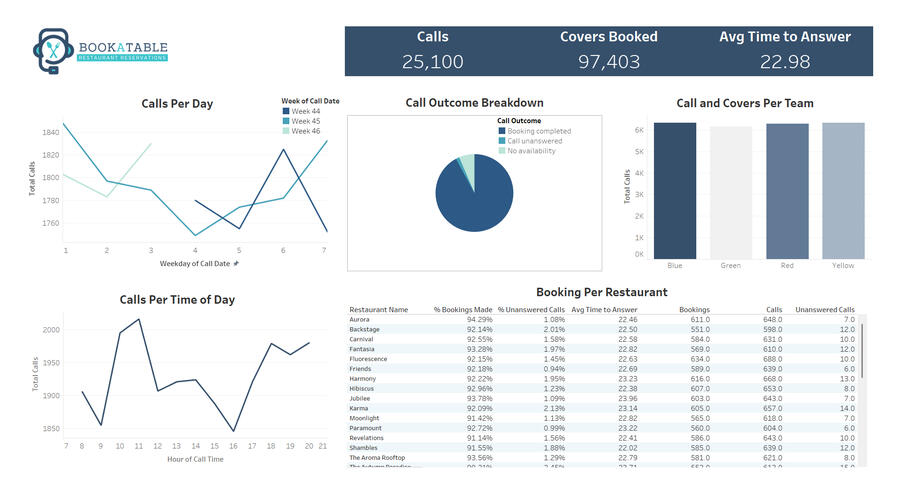
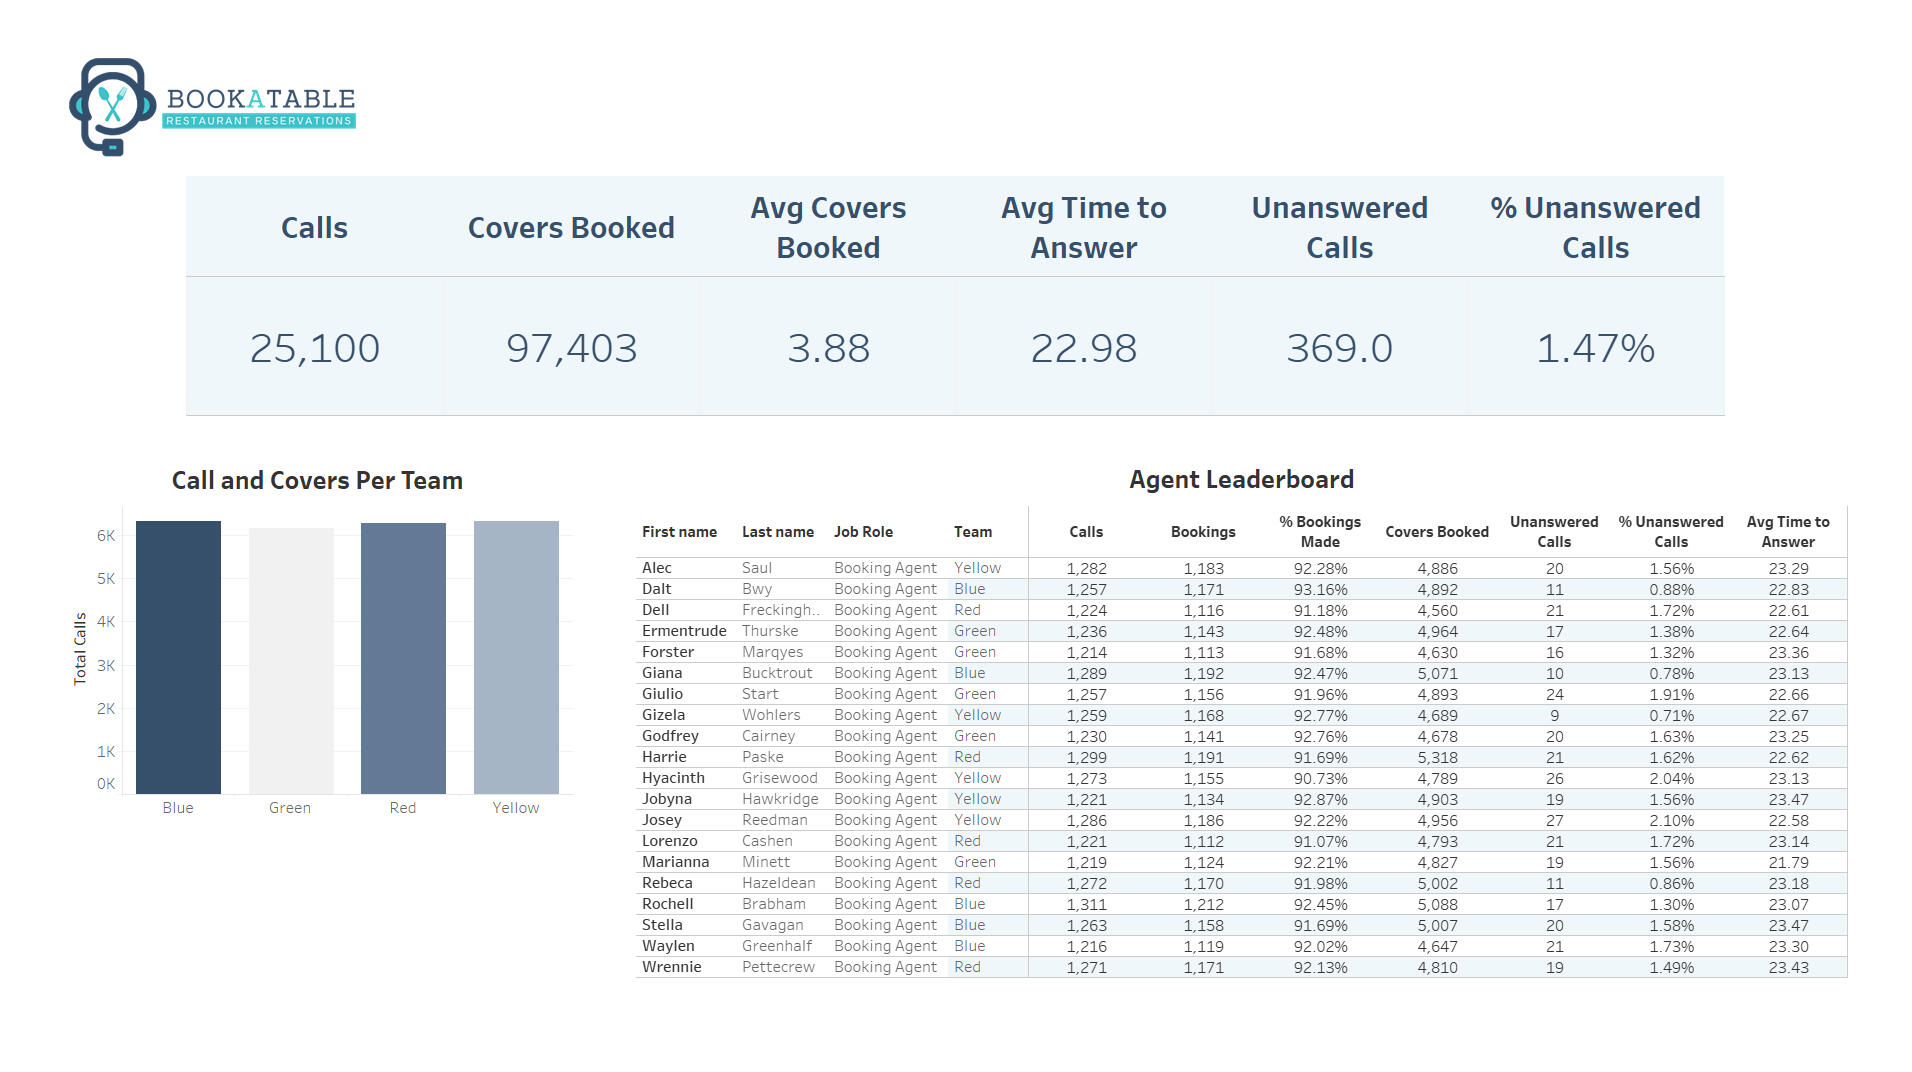
Insights
The management team now has the ability to review the performance of their sales teams. As more data is added to the dashboard, they'll be able to quickly make changes to improve their staff and make recommendations.Looking at the current status of the dashboard, management can see their sales teams are producing similar results.The team leads will have the opportunity to look for "holes" in their teams processes. This will help them follow-up with agents in a timely manner to review processes or provide training where needed.Blue team has 10+ less missed calls compared to the other teams. This can be reviewed to see if they might be doing something different when answering calls that the other teams are not doing.Dalt & Giana (Team Blue) and Gizela (Team Yellow) might be 3 of the top performers, based on % Bookings Made and % Unanswered Calls.
Tools Used
1. Microsoft Excel
2. Google Sheets
3. TableauData Files
Two spreadsheet data files containing call centre data were imported and joined in Tableau Desktop to create the dashboards:
1. An Excel XLSX file containing 'Staff and Teams' and Restaurant data
2. A CSV file containing tracked calls data

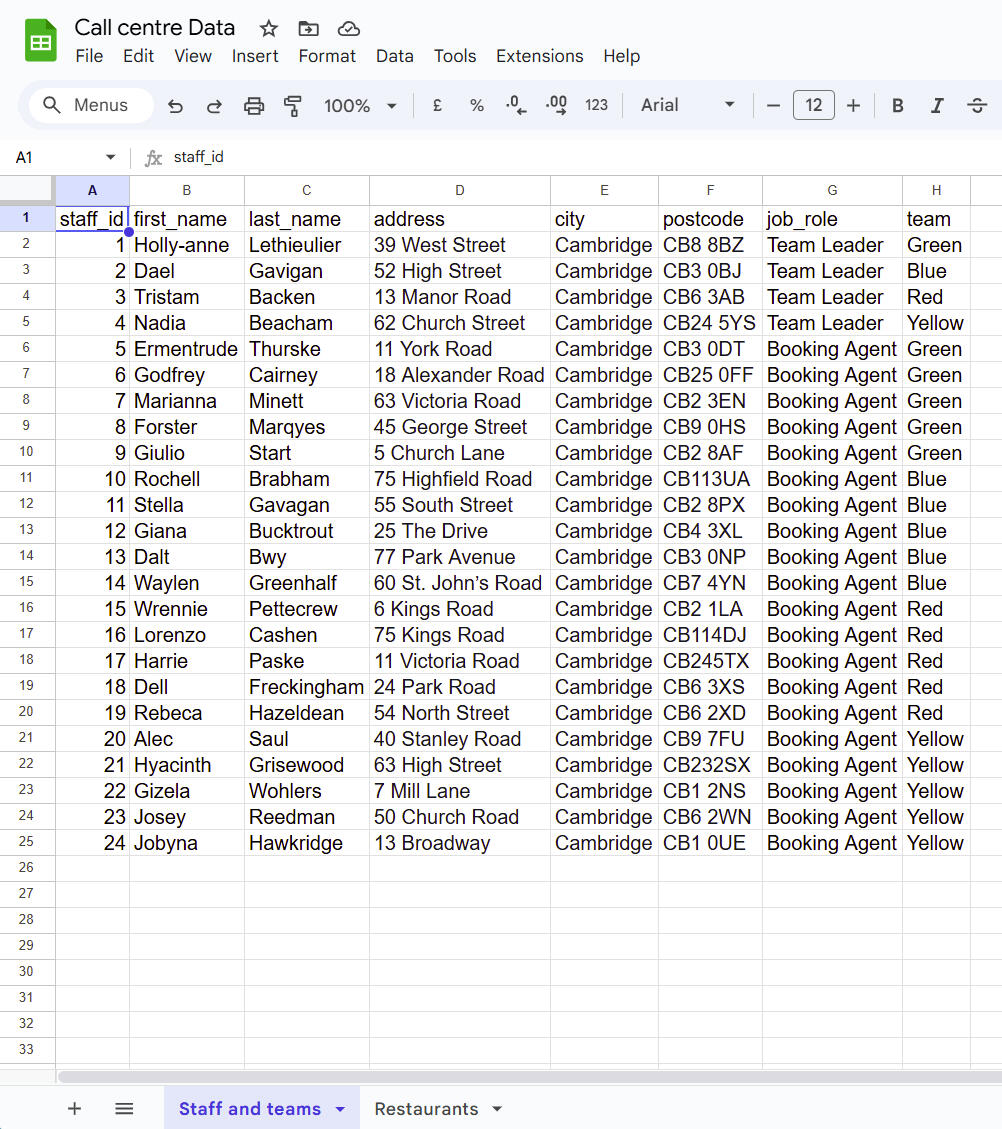
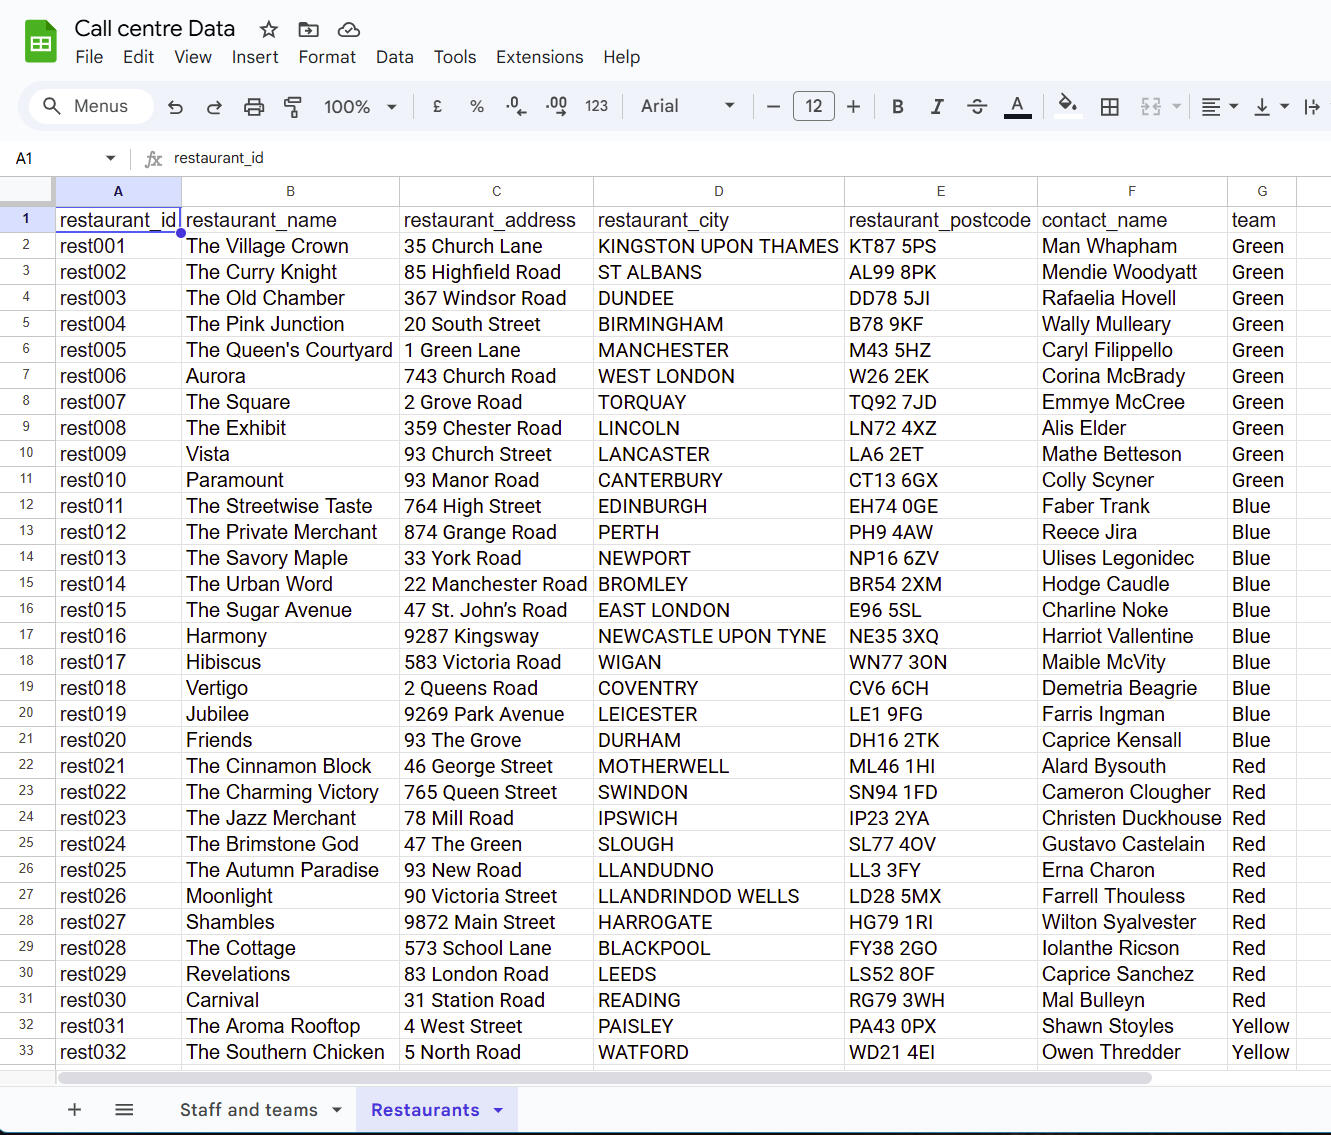
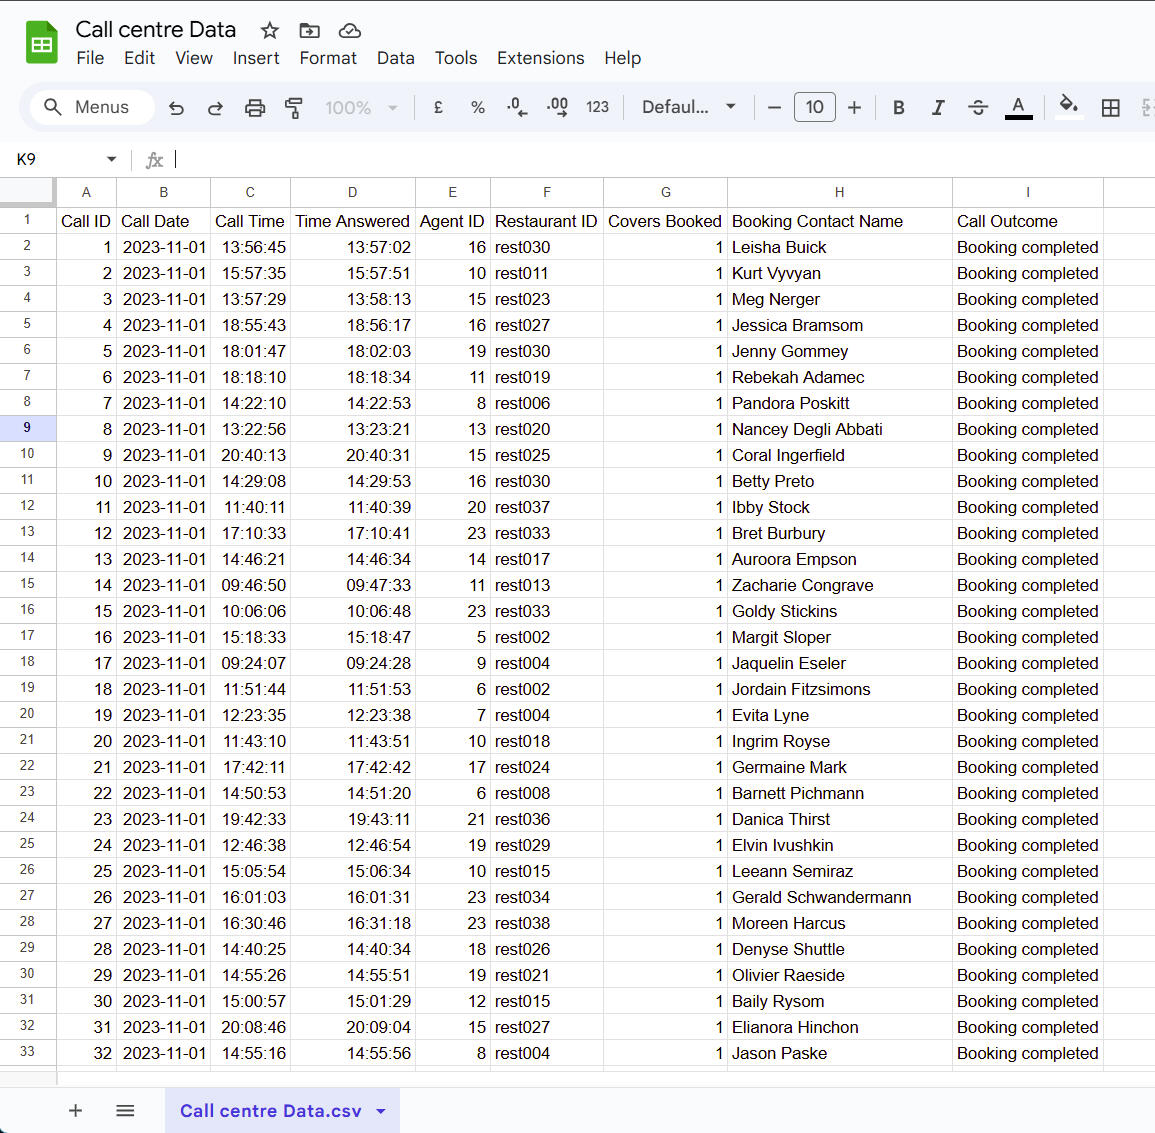
Tableau Calculated Measures
Calculated measures were created and added to the appropriate dashboard in the building process:
Bookings
Used to help count the number of bookings.

Time to Answer
The number of seconds it took to answer a call.

Total Calls
A distinct count of all calls agents received.

Unanswered Calls
Used to help count the number of missed calls.

% Bookings Made
Percentage of bookings made by an agent.

% Unanswered Calls
Percentage of missed calls by an agent.

Interests
Would it be useful for BookATable to breakdown agent stats by quarter, monthly, and/or weekly?
Issue Corrected within the Data
The source data for this project is manually generated. I found this to be an issue while testing the Agent Leaderboard table.An agent and their sales team make bookings only for their assigned restaurants. But, the data had agents making bookings for restaurants assigned to other sales teams, also.To correct the issue, I randomly assigned agents to their correct group of restaurants in the Call data. To do this, I used Excel's RANDBETWEEN() function.
Looker Studio
Hotel Reservations Dashboard
Other Tools Used:
QuickDBD,
Navicat Premium,
MySQL,
Microsoft Excel
PROJECT OVERVIEWClient:
ACME Hotels Inc.Client Problem
Reservation data for ACME Hotels was being stored in a single Excel worksheet. But, it became apparent the amount of data to be maintained was becoming unmanageable for them.Their reports were built in the same Excel workbook, making it hard to share information. The Office Manager was the only person with the Excel skills to update their weekly reports. So, when she was away, the reports were not getting updated.Client Request:
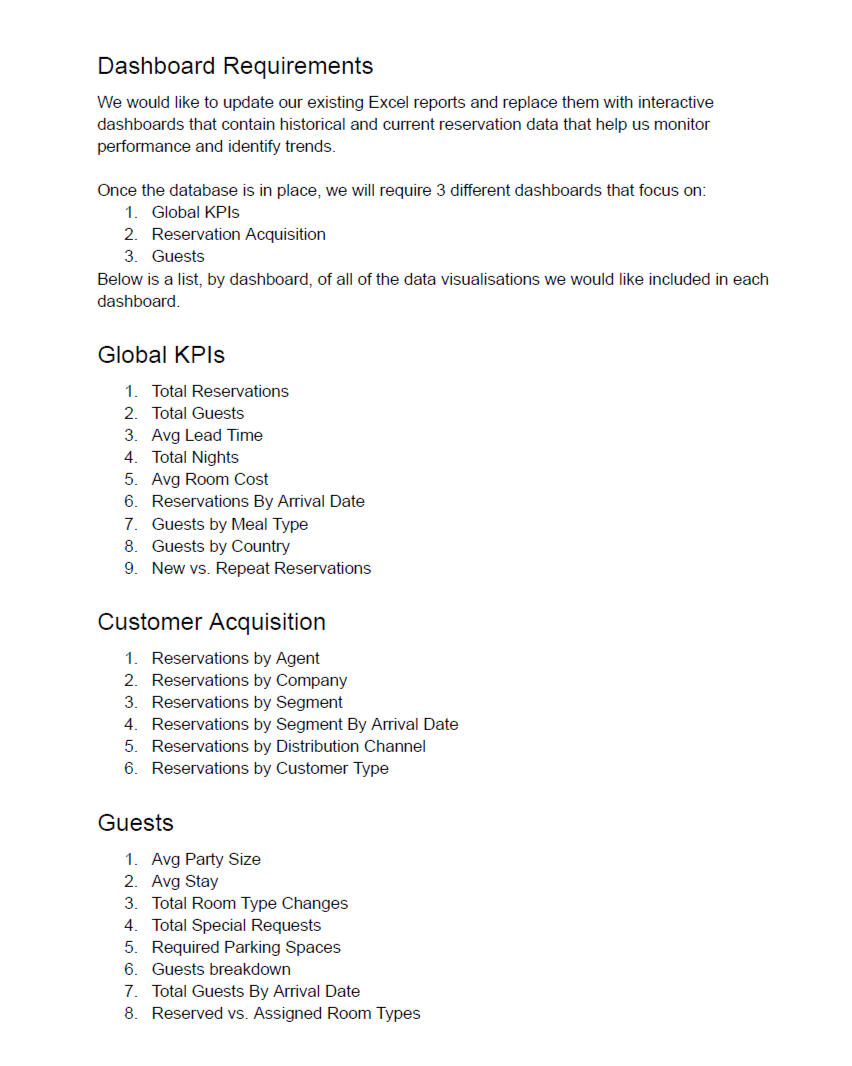
ACME Hotels requested to have automated reports updated with live data from the database. These reports need to be available online for all stakeholders. They also would like to have some interactivity added to the reports to help monitor performance and identify trends.A new database needs to be implemented with the fields requested in the project brief.The are 3 dashboards to be created:
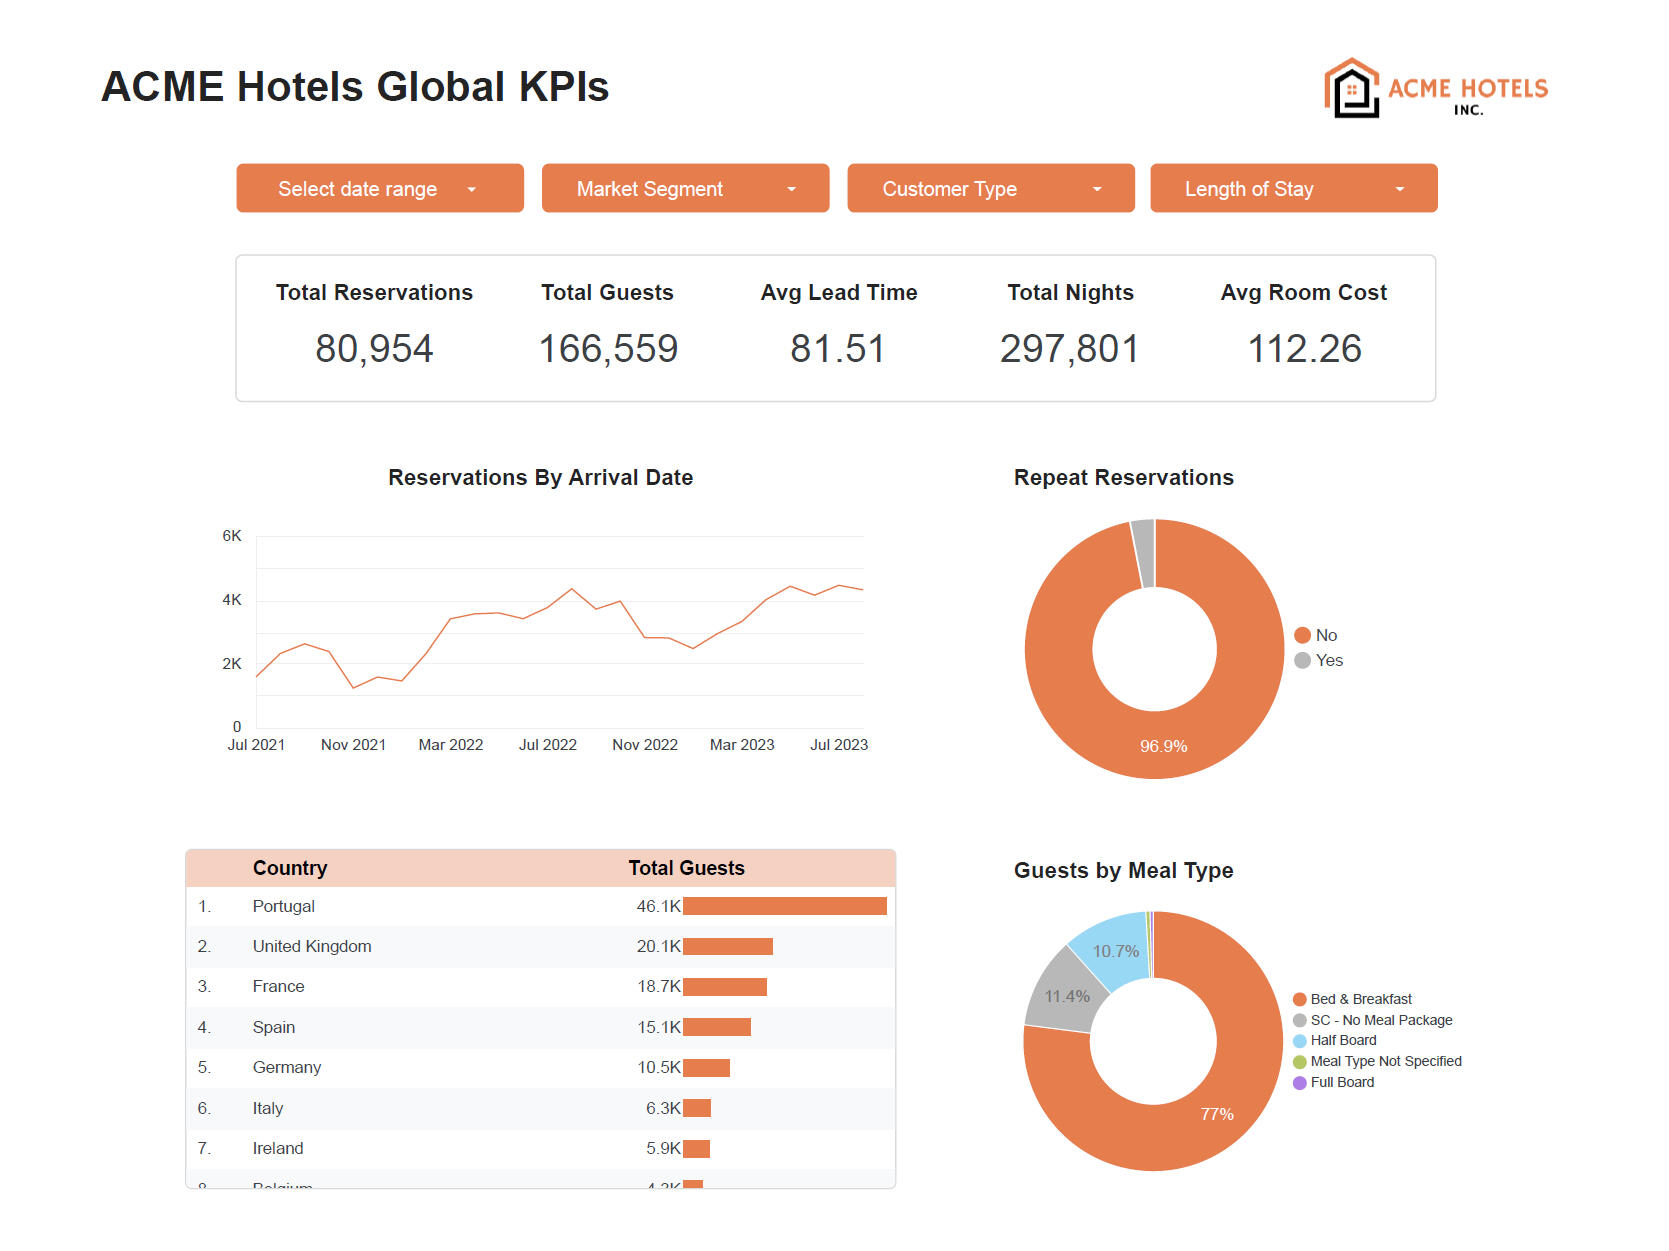
1. Global KPIs
- Total Reservations
- Total Guests
- Avg Lead Time
- Total Nights
- Avg Room Cost
- Reservations By Arrival Date
- Guests by Meal Type
- Guests by Country
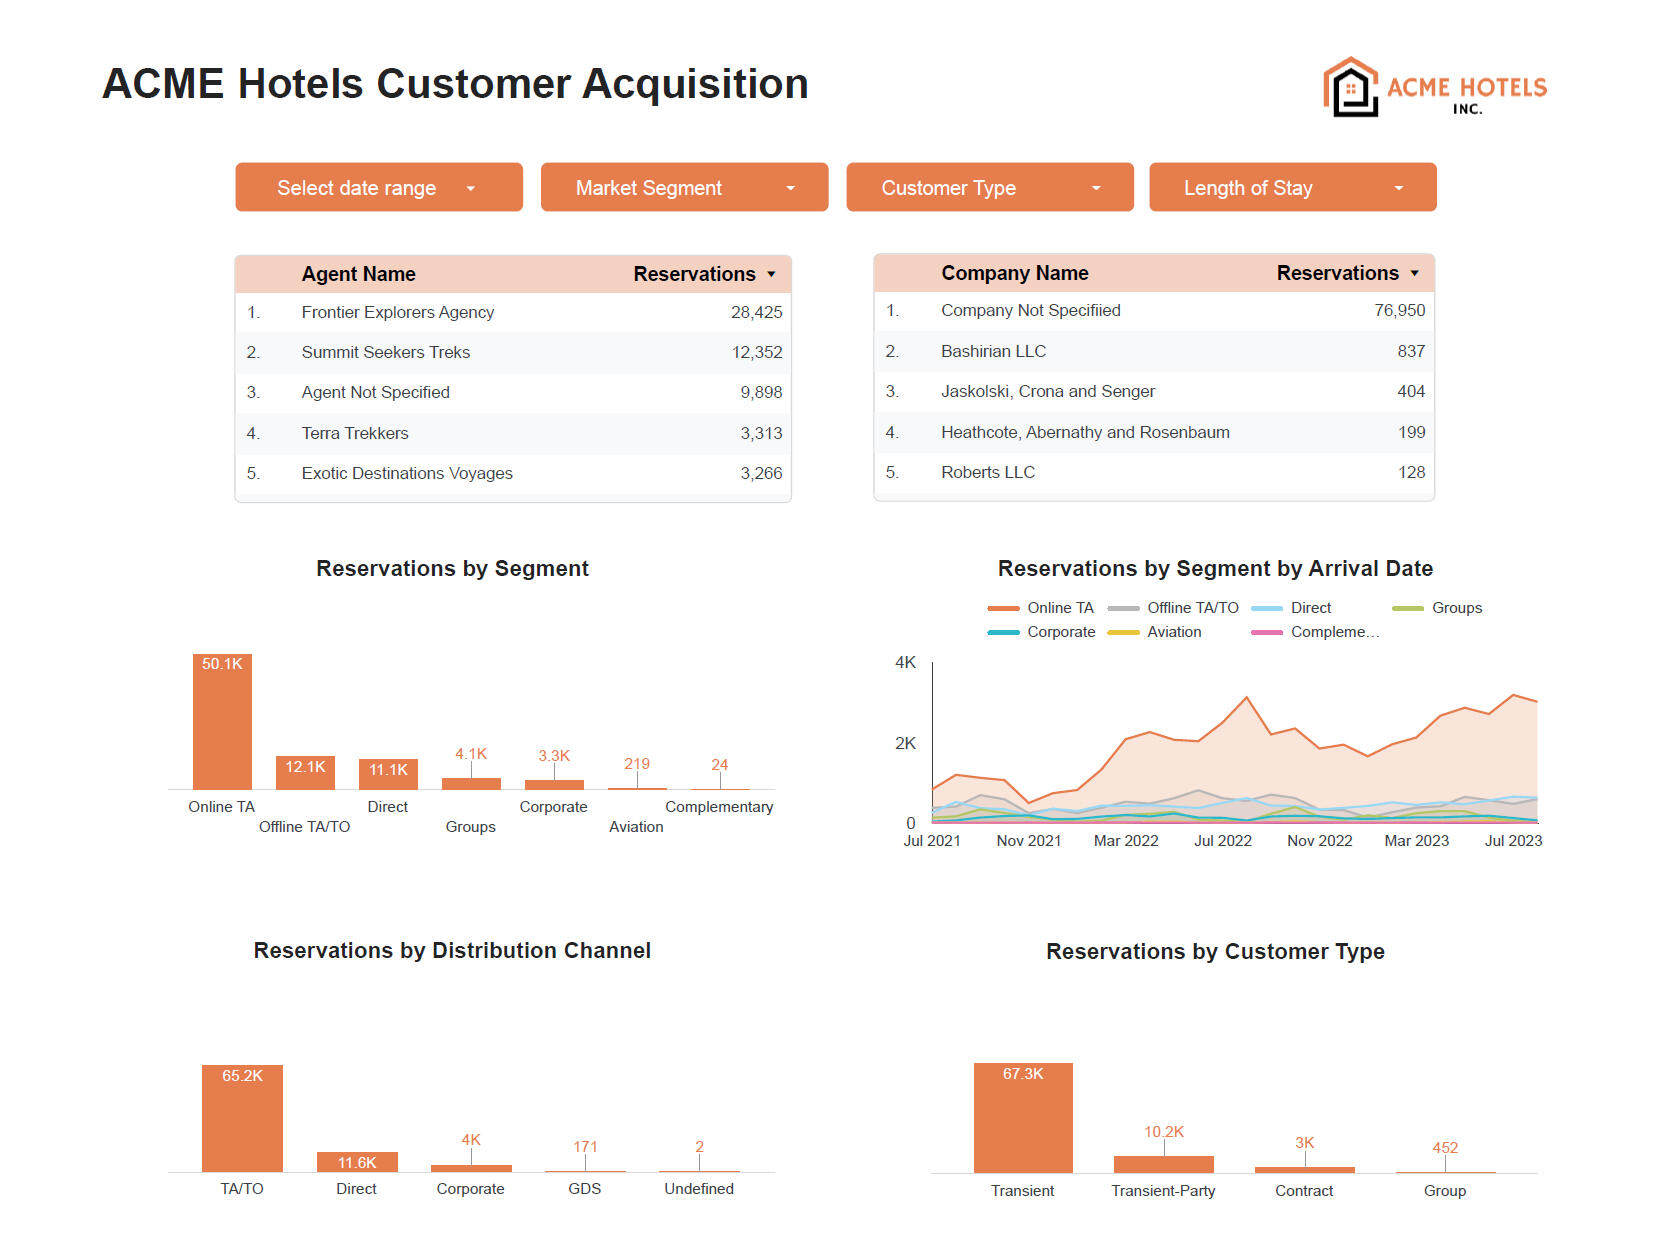
- New vs. Repeat Reservations2. Customer Acquisition
- Reservations by Agent
- Reservations by Company
- Reservations by Segment
- Reservations by Segment by Arrival Date
- Reservation by Distribution Channel
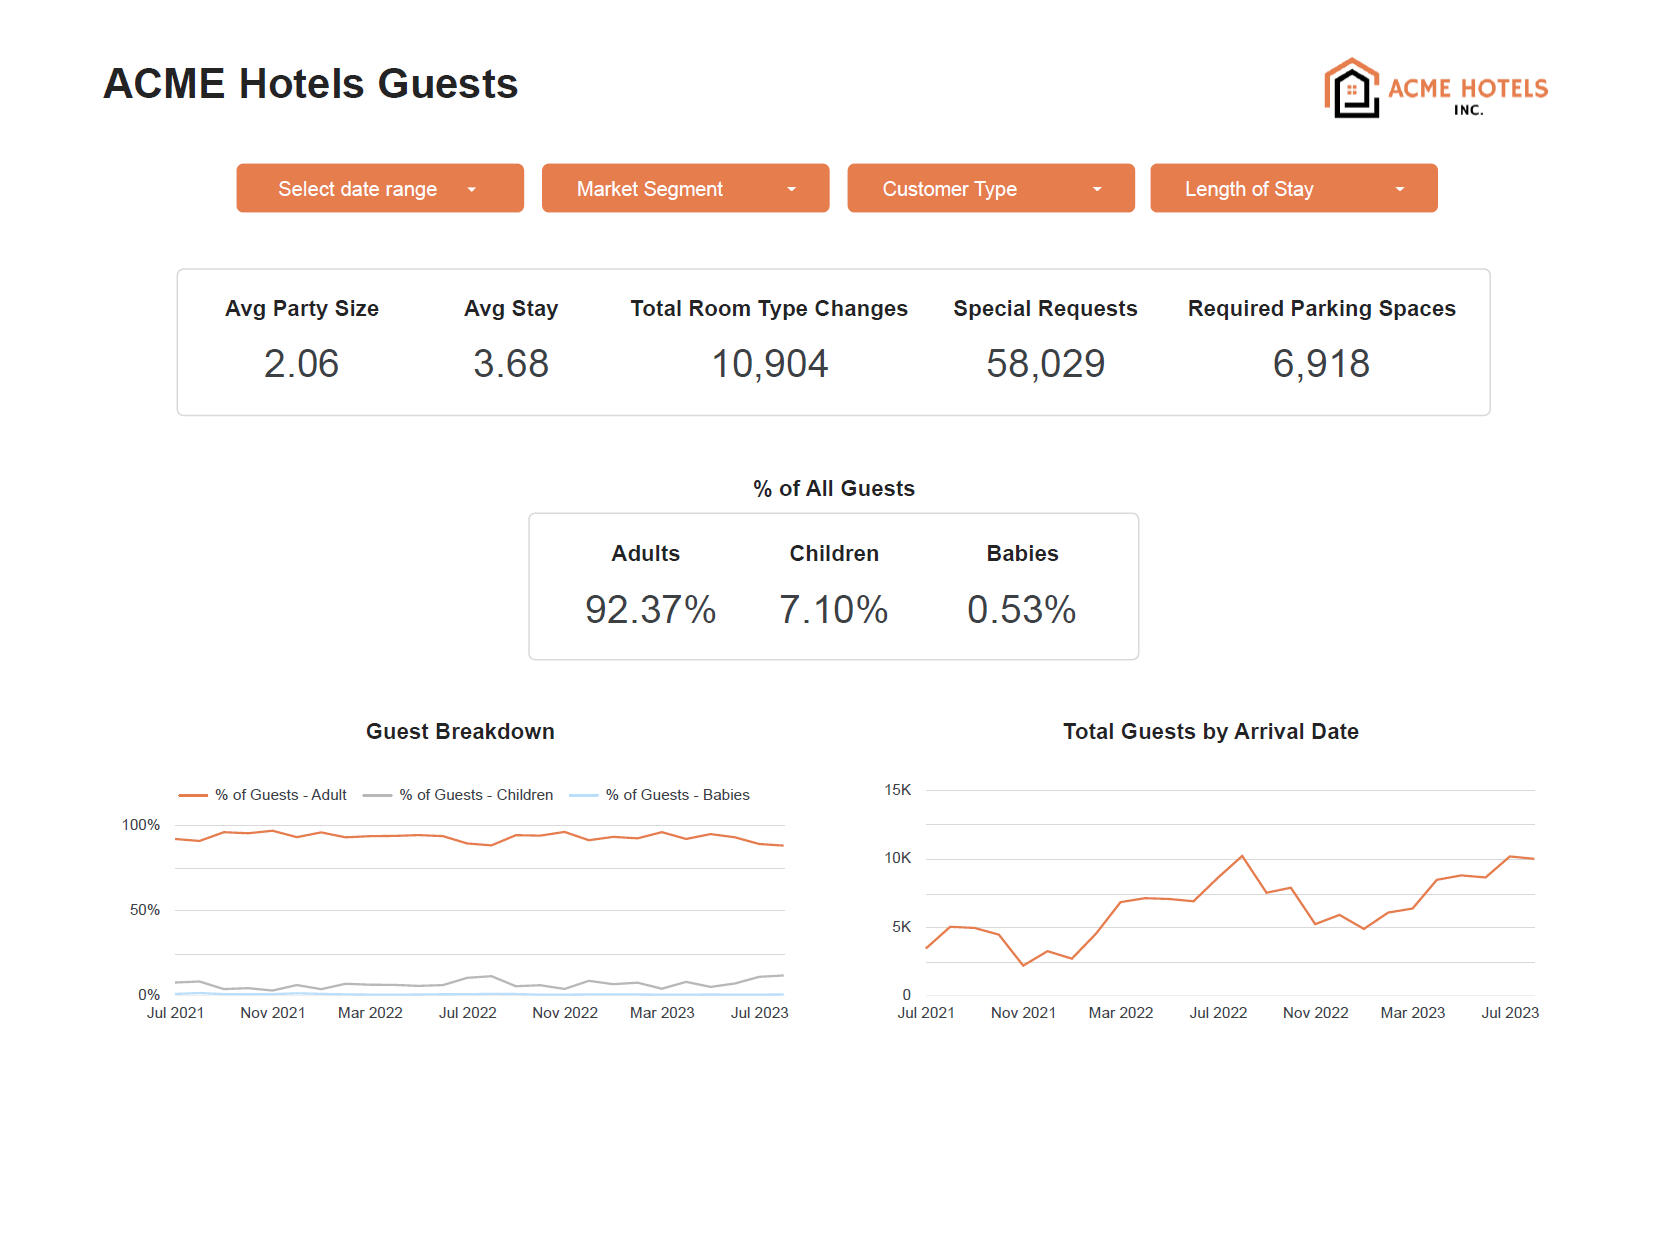
- Reservations by Customer Type3. Guests
- Avg Party Size
- Avg Stay
- Total Room Type Changes
- Total Special Requests
- Required Parking Spaces
- Guests Breakdown
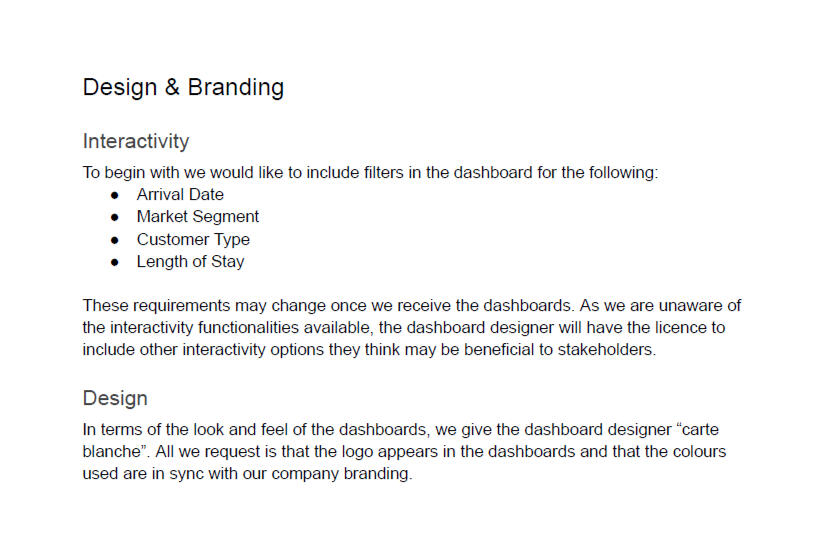
- Total Guests By Arrival DateThe interactivity requested to be included are filters for:
- Arrival Date
- Market Segment
- Customer Type
- Length of Stay
Project Brief
This project brief includes ACME Hotels description of their reporting concerns. And also their requirements for the new dashboards.
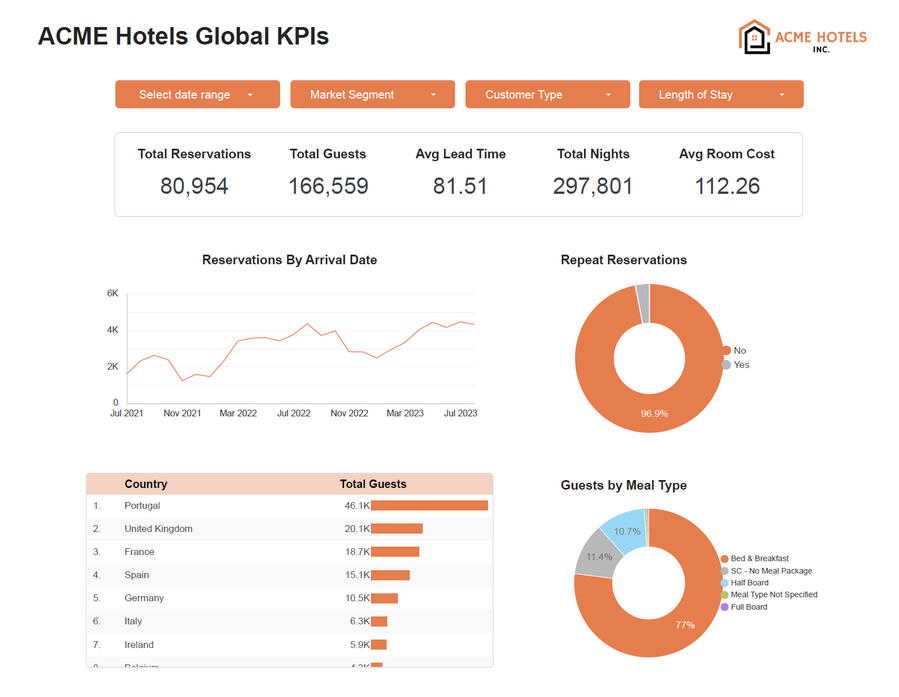
Insights
With three new dashboards, ACME Hotels has a lot of data to play with. The filters apply to all dashboards and can help them find insights by date, segment, customer type, and length of stay. They'll also be able to filter by date ranges to figure out their busiest and slowest times of the year.It's easy to see where the top reservations are coming from for Segment, Distribution Channel and Customer Type. But, it's also easy for them to see where the lowest amount of reservations are coming from. This might be something for them to consider - should the focus on their top sources and drop the lowest ones?
Tools Used:
1. QuickDBD
2. Navicat Premium
3. MySQL
4. Microsoft Excel
5. Looker StudioData Used:
The data was defined in 8 CSV files as follows:
1. Agents
2. Bookings
3. Channels
4. Companies
5. Countries
6. Customer Types
7. Meals
8. Segments
PROJECT WALKTHROUGHDatabase Diagram
A database diagram was created based on the database requirements and using the 8 CSV files. This diagram was used to help build the new database.
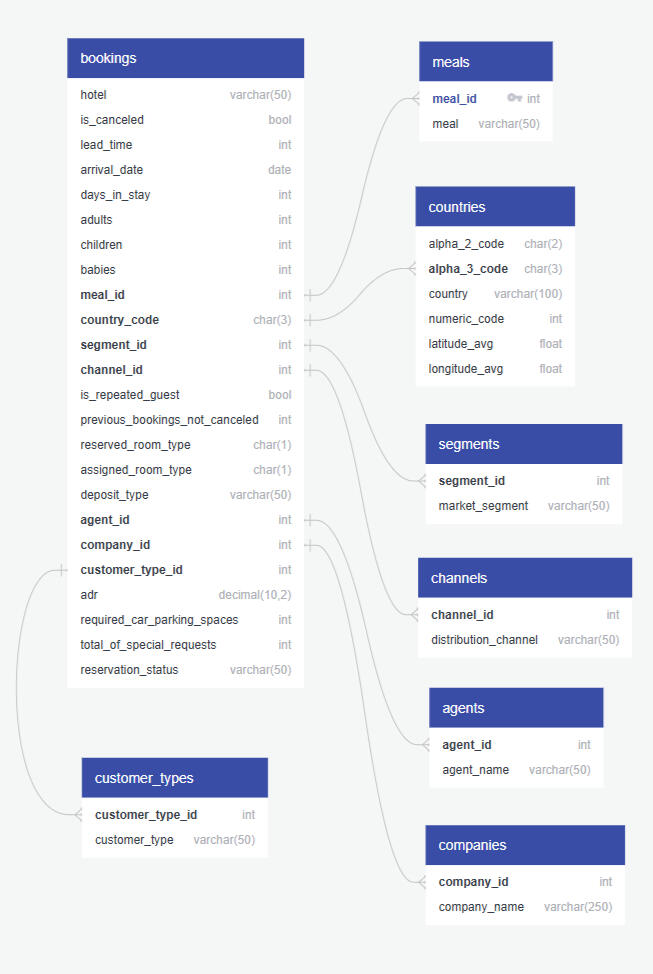
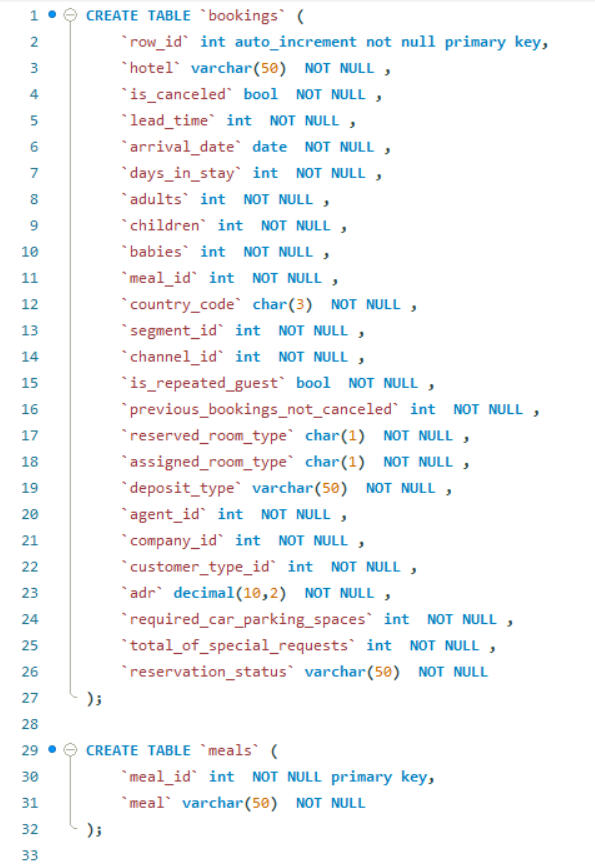
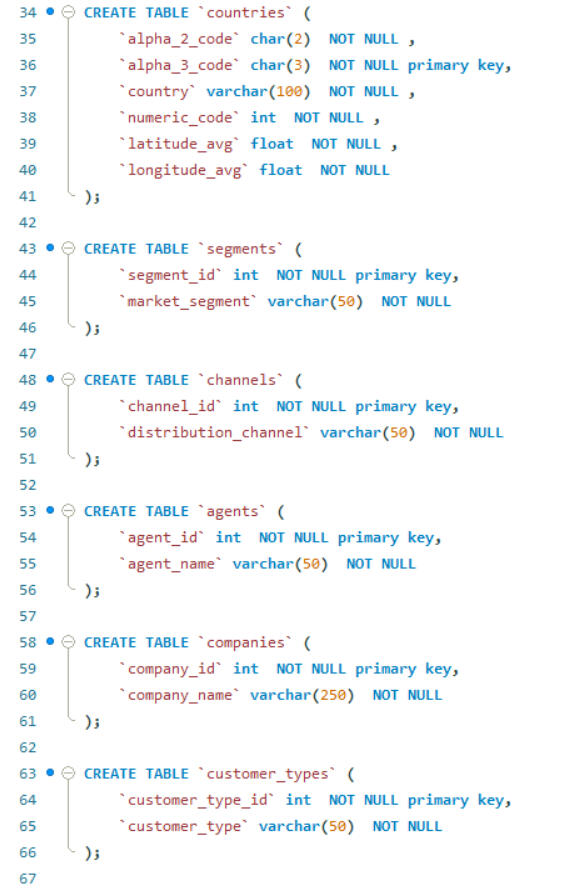
Database Tables
These SQL queries built the tables for the new database based on the database diagram. Each table was populated with the appropriate data from the CSV files.
SQL Query
A single SQL query was created to get the required data from the database for the 3 dashboards. This data source was added into Looker Studio to build the dashboards.

Looker Studio Data Updates
A few data updates were created in the process of building these dashboards:
Agent Name
Populate agent name where the value is null.

Company Name
Populate company name where the value is null.

Country
Populate country where the value is null.

Meal Type
Populate meal type where the value is undefined.

Repeated Guest
Changed the Boolean value to 'Yes' or 'No'.

Looker Studio Calculations
A few calculations were created in the process of building these dashboards:
Room Type Changes*
Used to help get a count of rooms changed after the original reservation.

% of Guests - Adult*
Percentage of adult reservations.

% of Guests - Children
Percentage of children reservations.

% of Guests - Babies
Percentage of baby reservations.

Avg Party Size
Average number of guests.

Total Guests
Total number of guests.

Interests
Data specific questions for ACME Hotels to look into could be:
- Why is there a lot of "Not Specified" data for Agent and Company Names?
- Would it make sense to drop low producing segments and distribution channels?
- Is there a reason why 97% of reservations are not repeat customers?
- Is there a common reason for Room Type changes?
- Are there common special requests that could be implemented before guests arrive?